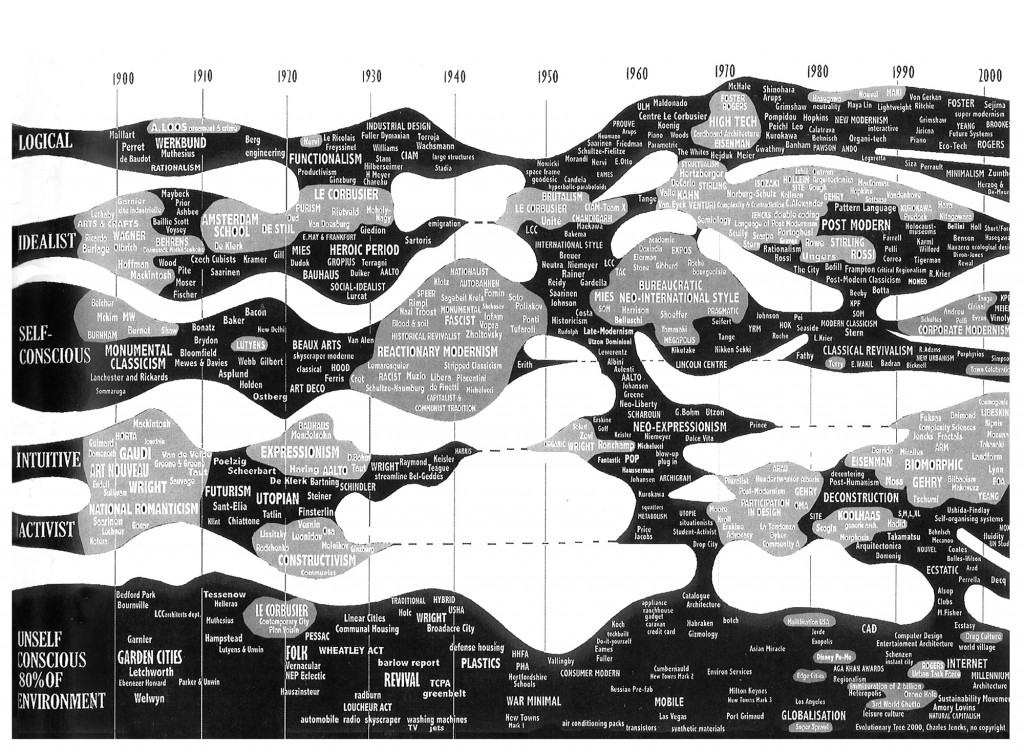
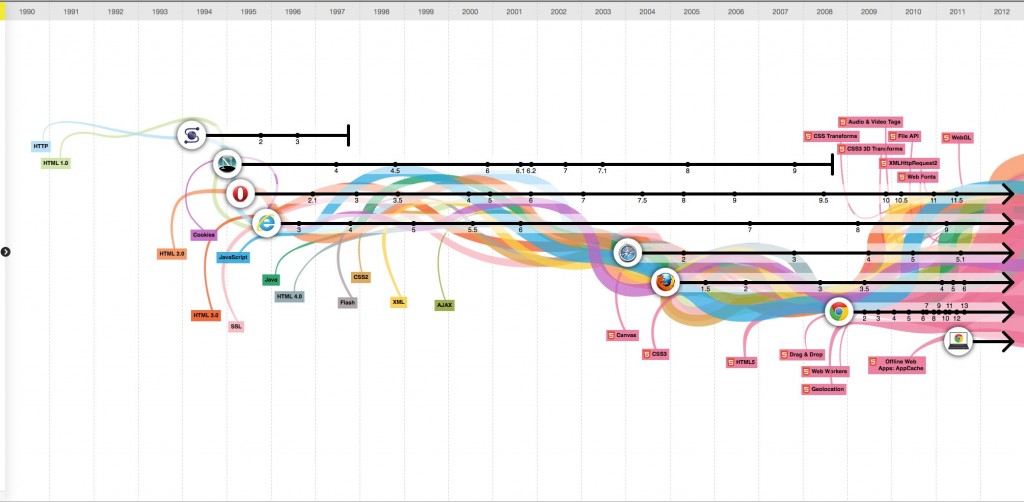
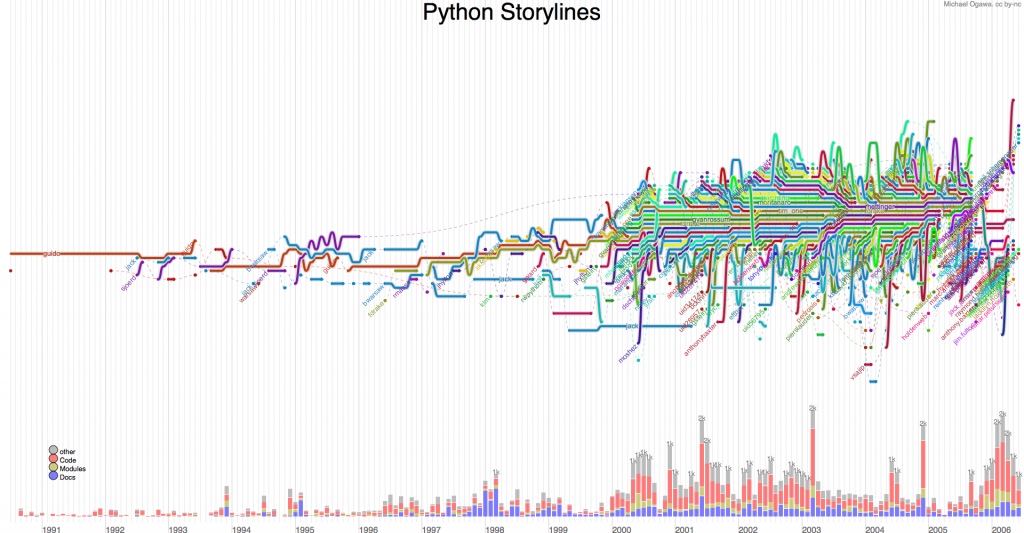
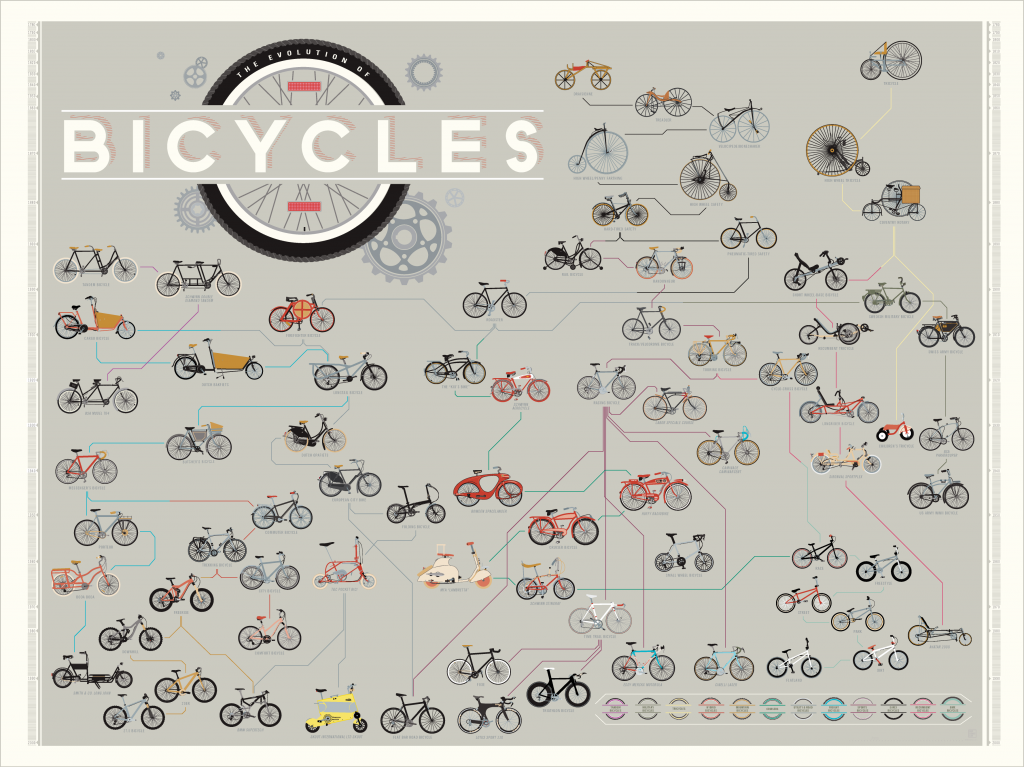
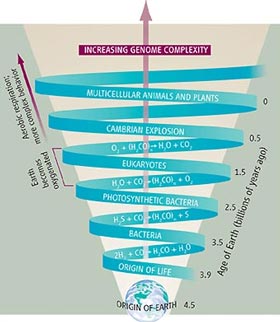
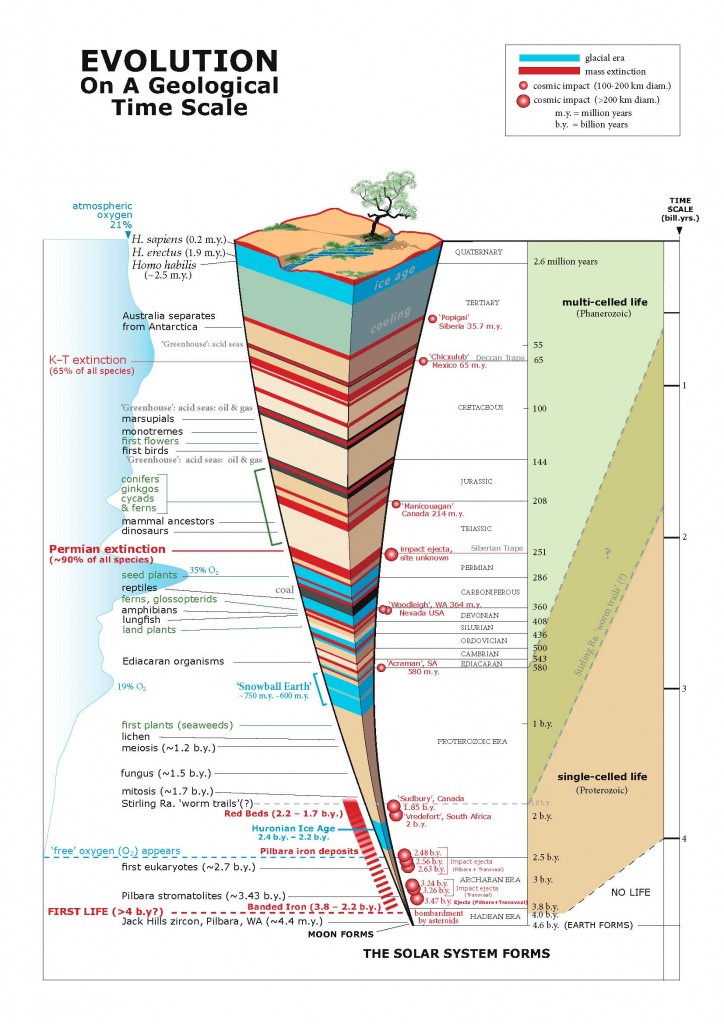
The scientific (and sometimes not-so-scientific) study of evolution has produced a wealth of visual schemas that might provide some inspiration to the design of user interfaces for creative evolutionary software. Below is a sample of some the ways in which evolutionary relationships have been visualized.
The Tree of Life
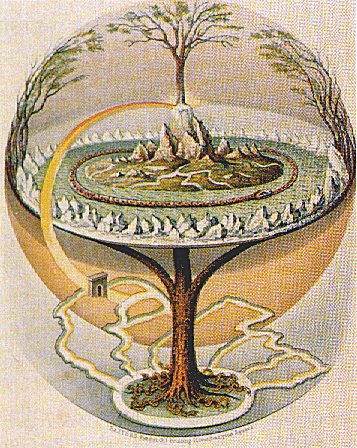
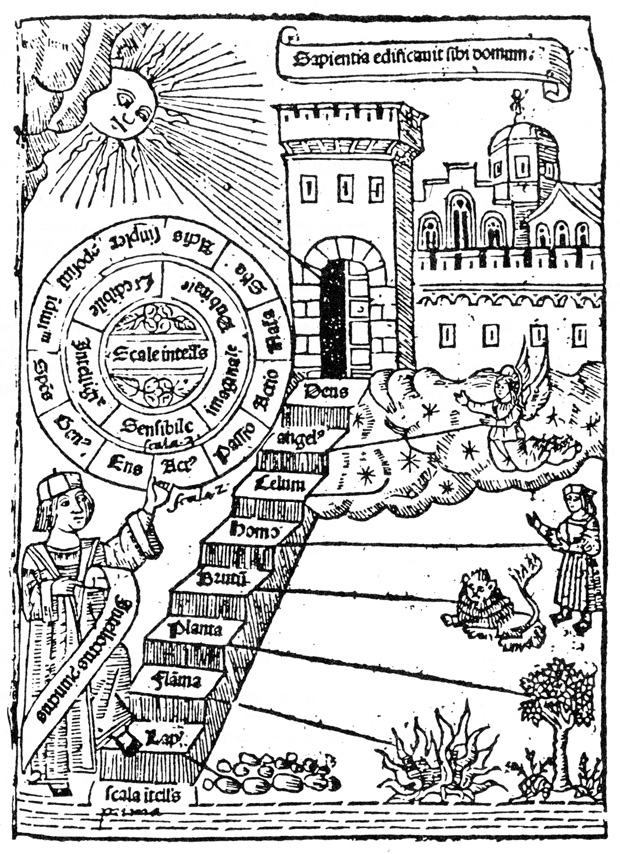
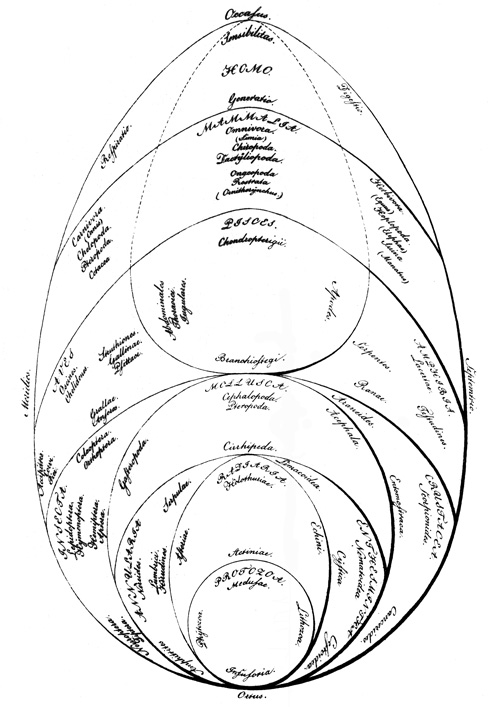
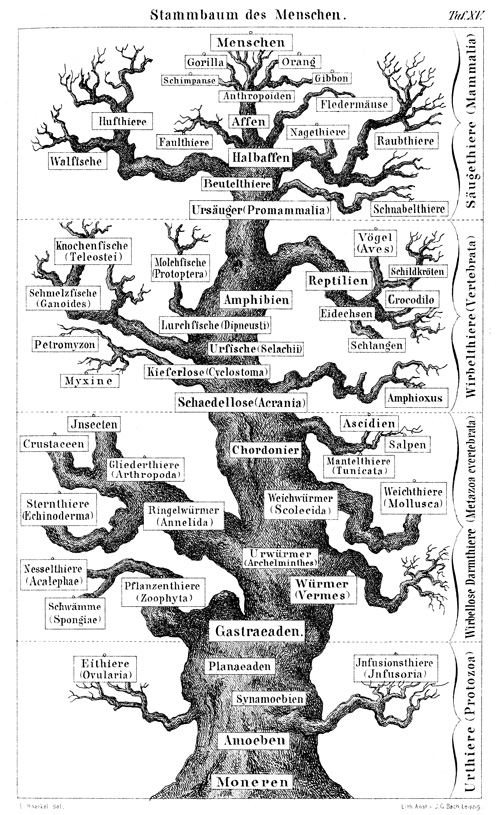
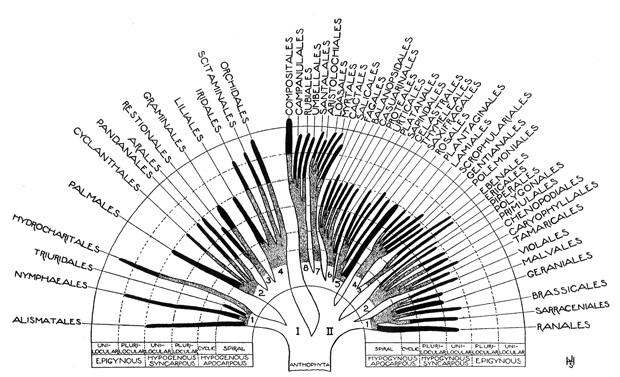
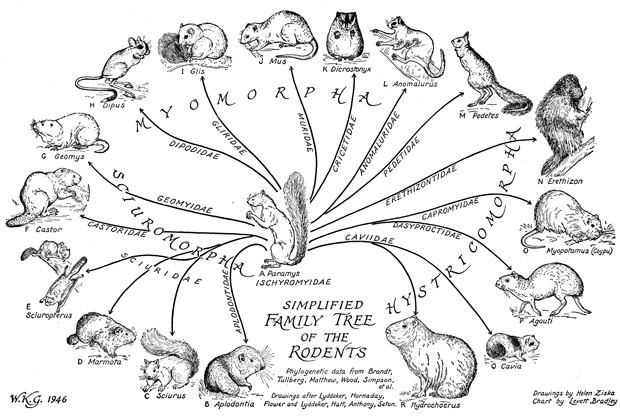
Visualizing the relationships between lifeforms greatly predates Darwin’s theory of evolution. In scientific, mythological and religious contexts, the concept of a tree of life has provided a common trope in both taxonomic and symbolic visualizations of the interconnection of life on our planet. Here are some examples:
The March of Progress
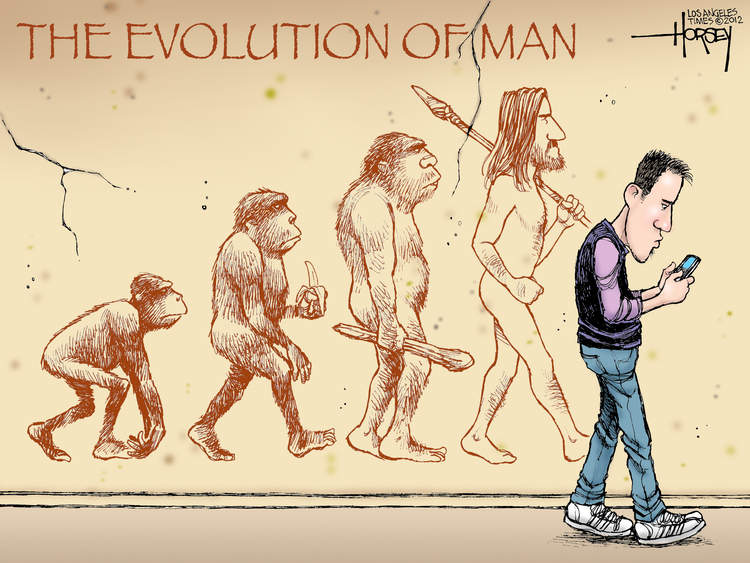
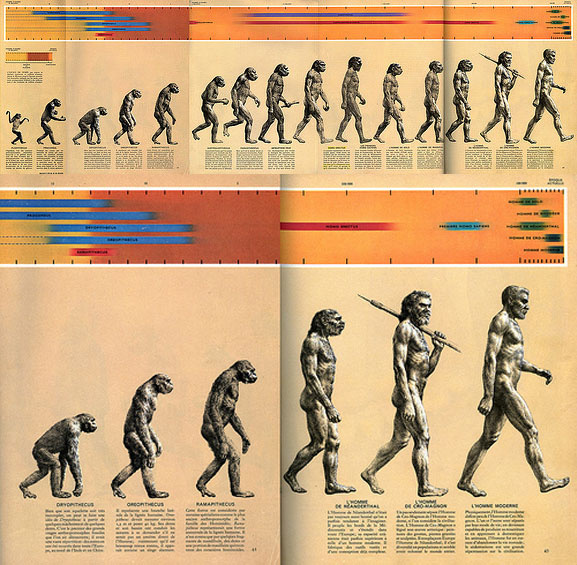
One of the most iconic visualizations of evolution is The March of Progress, a linear illustration of human evolutionary forebears, originally depicted in the Time-Life book Early Man. Though it provides an easy-to-understand model for human evolution, it is also scientifically reductive in that it implies a simple linear progression towards an ideal and final form — “Modern Man.”
Steven Jay Gould said of this illustration, “The march of progress is the canonical representation of evolution – the one picture immediately grasped and viscerally understood by all… The straitjacket of linear advance goes beyond iconography to the definition of evolution: the word itself becomes a synonym for progress…. [But] life is a copiously branching bush, continually pruned by the grim reaper of extinction, not a ladder of predictable progress.” (Citation).

Graphs, Trees & Networks
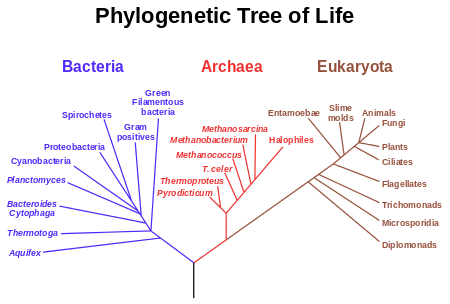
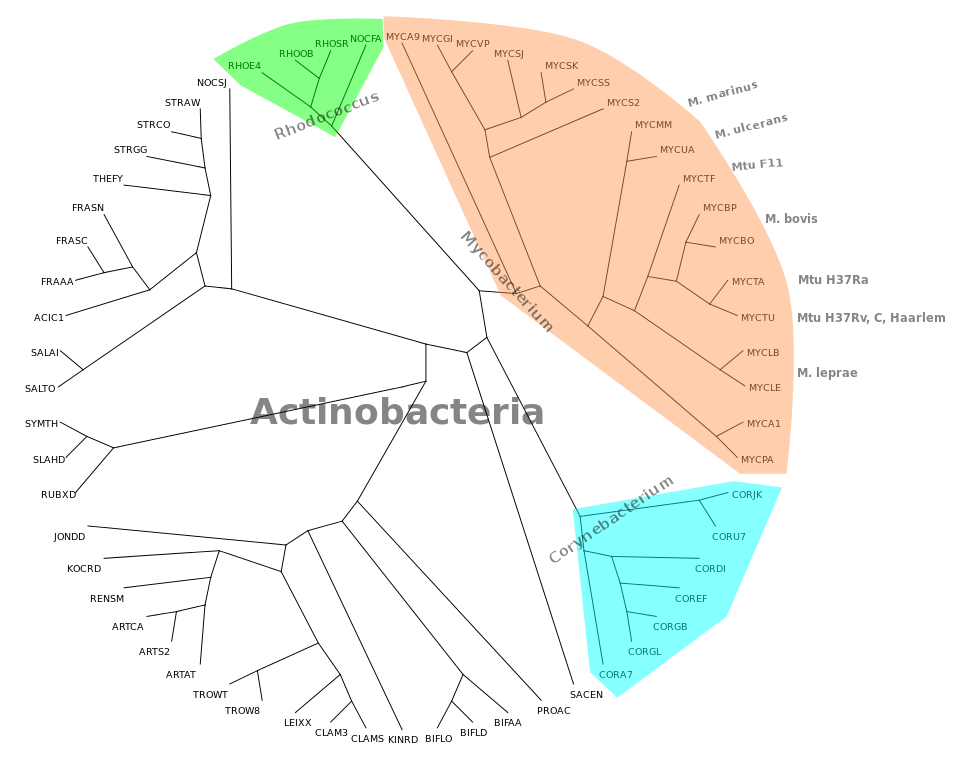
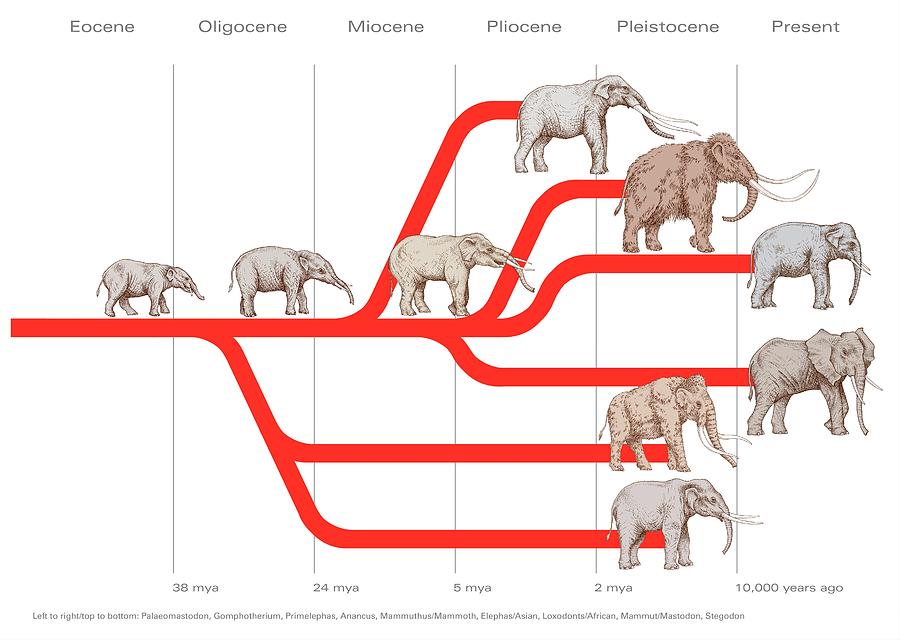
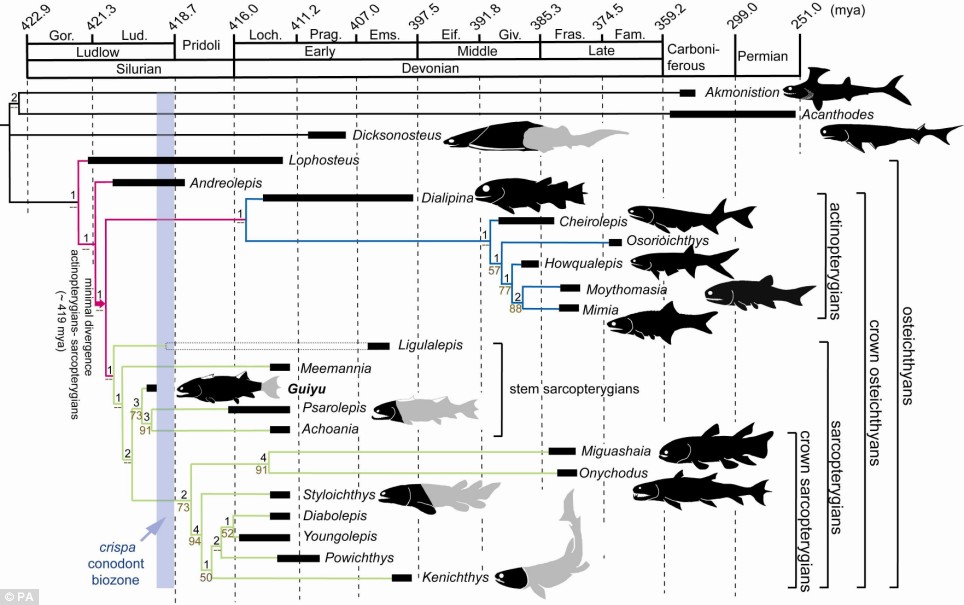
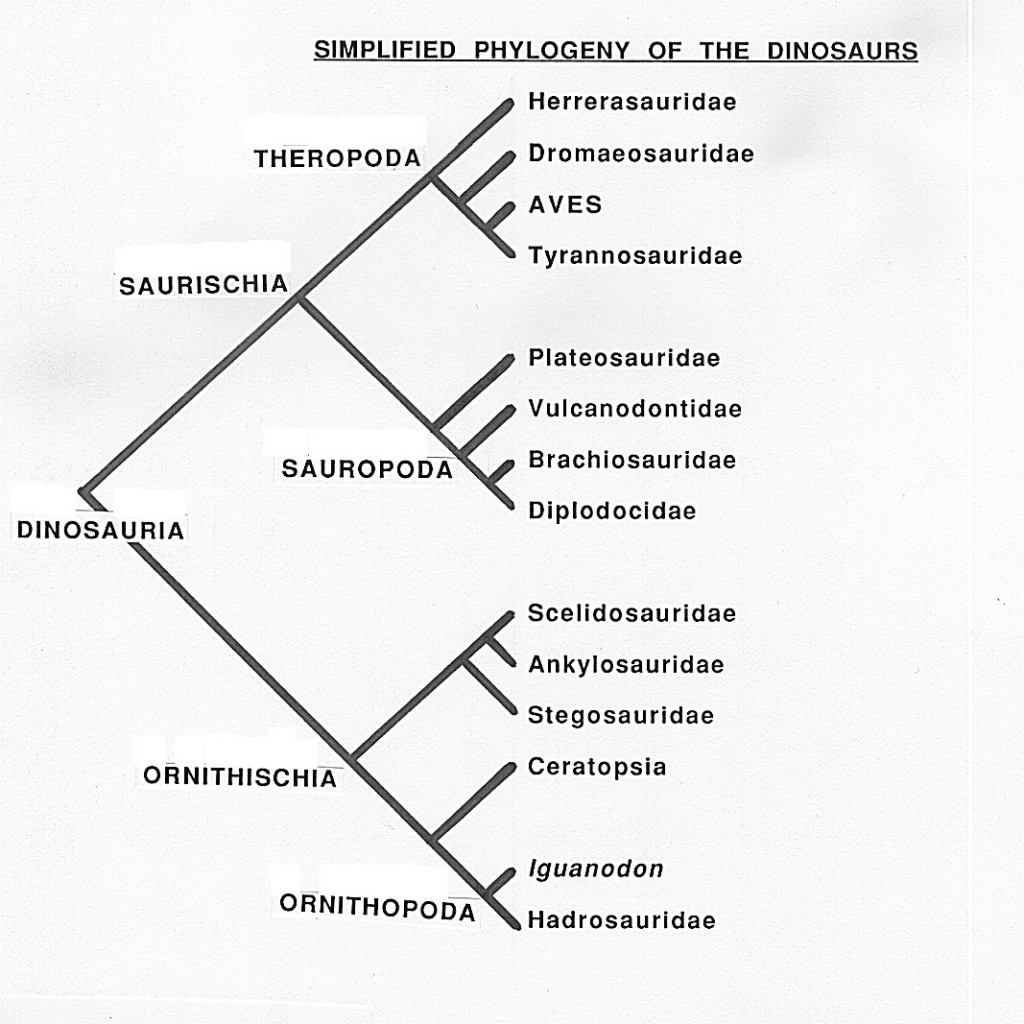
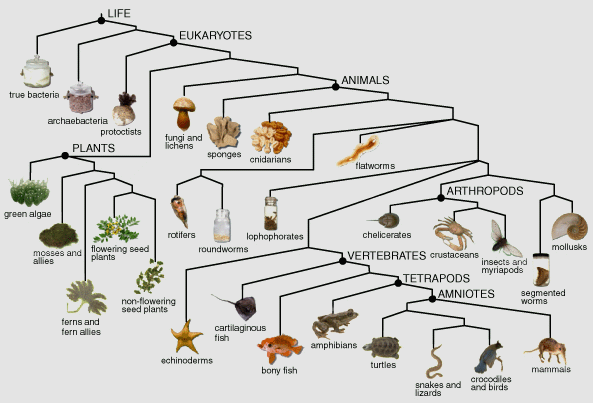
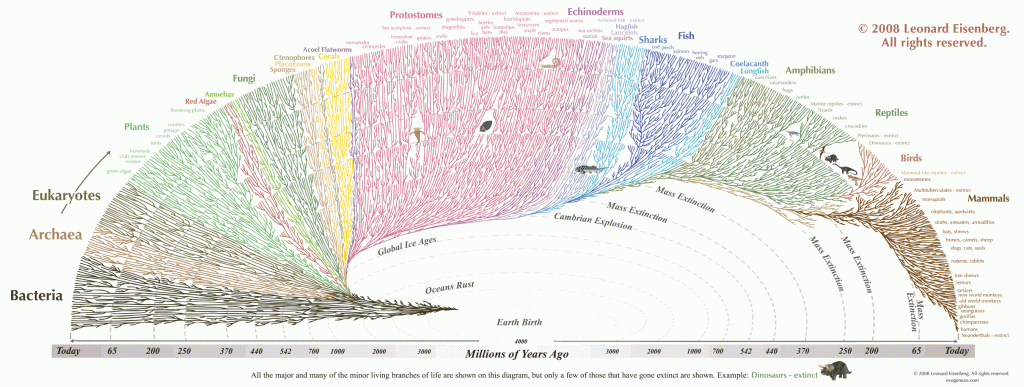
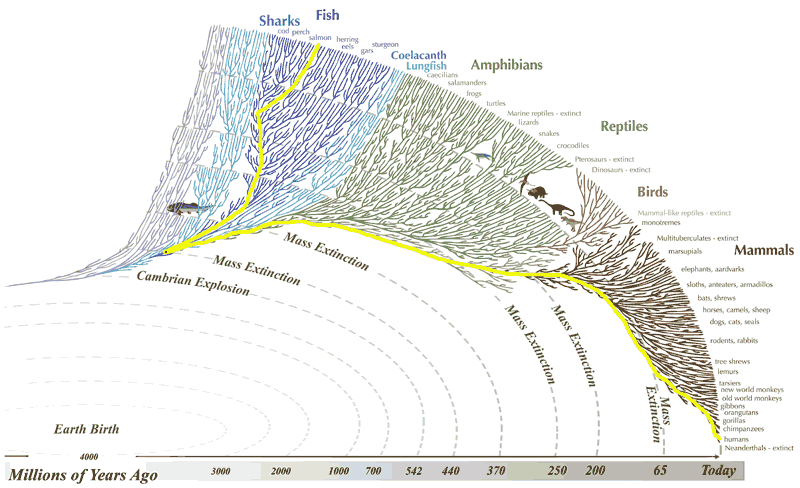
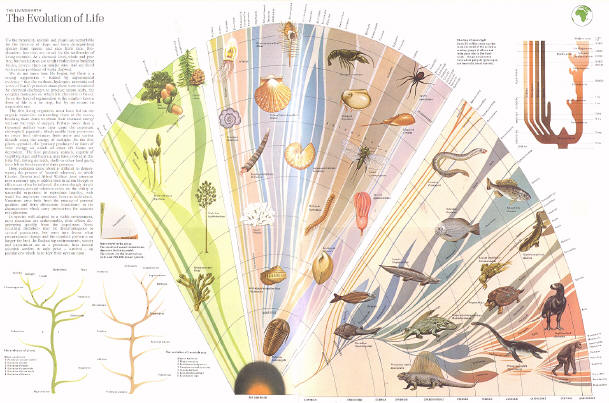
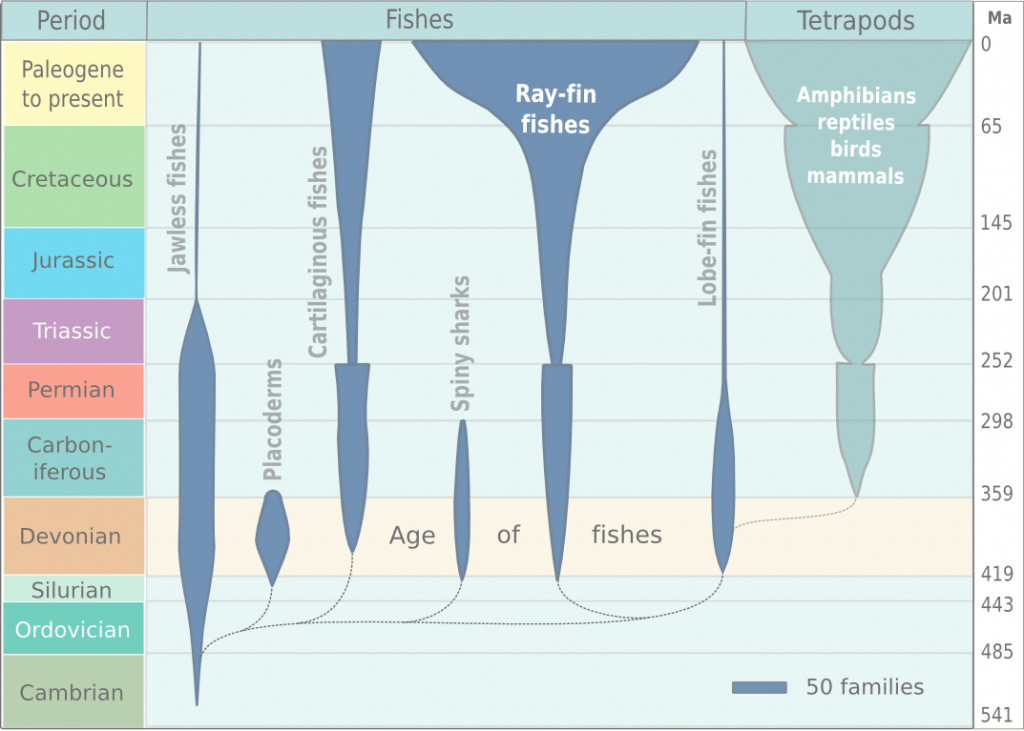
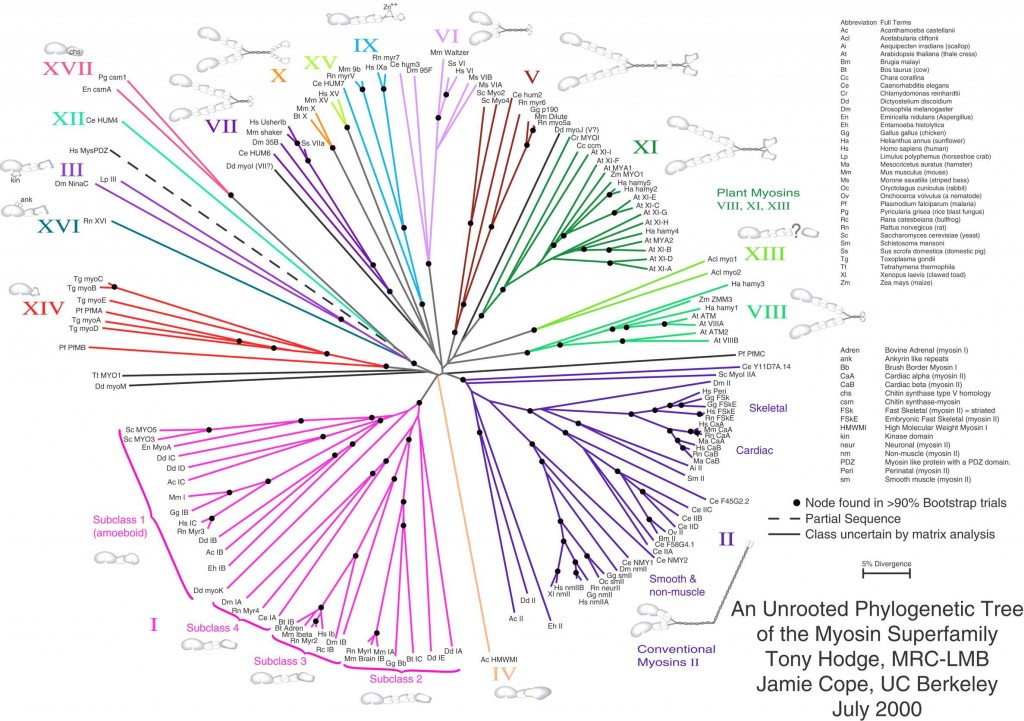
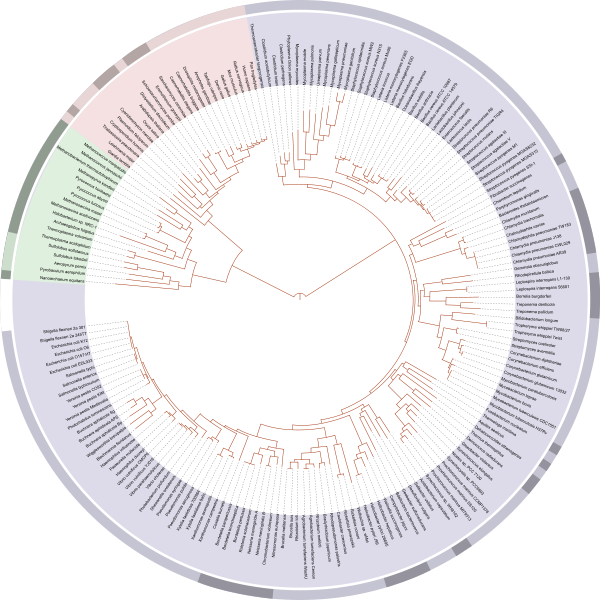
To more accurately depict evolutionary considerations such as timescale and genomic distance as well as capture the complex branching relationships inherent to evolutionary processes, many scientific diagrams representing systems of this kind are organized as trees or networks, two types of graphs. More specifically, Phylogenetic trees and Phylogenetic networks provide common schemas for illustrating biological evolution. As described at the sites linked above, there are several styles within each of these categories of diagrams. In particular, it may be instructive to look at how biologists and geneticists have devised systems for automatically generating visualizations from genomic data. The Interactive Tree of Life site provides some interesting illustrations. Personal genomics companies such as 23andme also offer some interesting approaches to the visualization of genomic data. Below is an assortment of rooted, unrooted and bifurcating phylogenetic trees and networks:
Some Variations & Applications